How We Debug With LLMs: A Three-Tier Approach That Works 95% of the Time
Debugging is one of those tasks where AI truly shines — but only if you use it the right way. Over months of building Life Butler, we’ve developed a three-tier debugging workflow that solves 95% of bugs in the first attempt, and handles even the most complex issues systematically.
The key insight? Start broad, then get surgical. Don’t immediately dive into the debugger. Give the AI enough context to see the problem holistically first. Most bugs are obvious once you look at them from the right angle — and LLMs are excellent at finding that angle.
Here’s our complete debugging methodology, step by step.
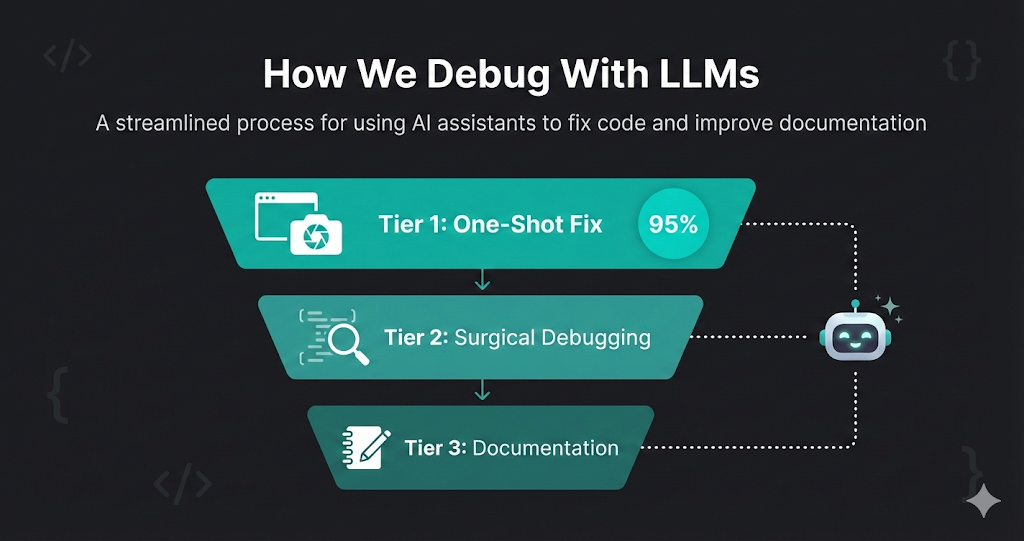
The Three-Tier Debugging Approach
The One-Shot Fix
Start with maximum context: a screenshot and your suspicion. 95% of the time, the AI finds and fixes the issue immediately.
- •Take a screenshot of the bug (UI, error message, or unexpected behavior)
- •Describe your general suspicion: 'I think the issue is in the payment flow' or 'This looks like a state management problem'
- •Share relevant code files or error logs
- •Let the AI analyze everything at once and propose a fix
- •Review the fix, test it, and ship if correct
Surgical Debugging
If the first attempt fails, break it down. Use a debugger to trace through the execution chain, checking variables at each step.
- •Set breakpoints at key points in the execution flow
- •At each step, ask the AI: 'Variable X should be Y at this point, but it's Z. Why?'
- •Move through the stack and sequence of events systematically
- •Use the AI's analysis at each checkpoint to identify where things go wrong
- •Apply targeted fixes based on specific findings
Documentation for Future LLMs
For complex bugs that required deep investigation, write a bug report that future LLMs (and humans) can reference.
- •Document the root cause, not just the symptom
- •Include the sequence of events that led to the bug
- •Explain why the fix works and what patterns to watch for
- •Add code examples and test cases that catch similar issues
- •Store in a searchable knowledge base for future debugging sessions
The Constant: Always Have an Assistant
Throughout every step of this process, we have an AI assistant at our disposal. Whether it’s Cursor’s Composer, Claude, or another model, the assistant is there to analyze, suggest, and help us think through each debugging decision. This isn’t about replacing human judgment — it’s about amplifying it with a second pair of eyes that never gets tired and can hold vast amounts of context.
Tier 1: The One-Shot Fix (95% Success Rate)
Success rate
95%
With a screenshot + suspicion + relevant code, the AI fixes the bug on the first attempt the vast majority of the time.
Most bugs are simpler than they seem. The problem isn’t that they’re hard to fix — it’s that we don’t have the right context to see them clearly. That’s where LLMs excel.
What We Provide
A Screenshot
Visual context is incredibly powerful. A screenshot shows the UI state, error messages, console output, or network requests — everything the AI needs to understand what’s wrong.
A General Suspicion
You don’t need to know exactly what’s wrong. Just share your hunch: “I think this is a race condition” or “This might be a state update issue.”
Relevant Code Files
Share the files you suspect are involved. Don’t worry about including everything — the AI will ask for more context if needed.
Error Logs or Stack Traces
If there are error messages, include them. LLMs are excellent at parsing stack traces and identifying the root cause.
What Happens Next
The AI analyzes everything together — the visual state, your suspicion, the code, and any errors. It looks for patterns, inconsistencies, and logical errors. In most cases, it finds the issue immediately and proposes a fix.
Why This Works So Well
LLMs excel at pattern matching and cross-referencing. They can see connections between the screenshot, your suspicion, and the code that a human might miss when looking at each piece separately. By providing everything at once, you’re giving the AI the full picture — and that’s usually enough.
Real Example
Example Prompt
[Screenshot showing a form with a disabled submit button]
“The submit button stays disabled even after filling out all fields. I suspect the validation logic isn’t updating the button state correctly. Here’s the form component and validation code.”
Result: AI immediately spots that the validation state isn’t being passed to the button component. Fix provided in 30 seconds.
Tier 2: Surgical Debugging (When Tier 1 Fails)
When the one-shot approach doesn’t work, it usually means the bug is more subtle — a timing issue, a state mutation that happens at an unexpected time, or a problem that only appears under specific conditions. This is where we get surgical.
The Process
Break Down the Execution Chain
Identify the sequence of events: user action → event handler → state update → re-render → API call → response handling. Map out every step.
Set Strategic Breakpoints
Place breakpoints at each major step in the chain. Don’t just break on the error — break on the steps that lead to it.
Check Variables at Each Step
At each breakpoint, inspect key variables. Ask the AI: “At this point, variable userData should be null, but it’s undefined. Why?”
Move Through the Stack
Step through the call stack, checking each function’s inputs and outputs. The AI helps identify where the expected value diverges from the actual value.
Apply Targeted Fixes
Once you find where things go wrong, the AI can suggest a precise fix for that specific point in the execution chain.
Why This Works
By breaking the problem into discrete steps and checking each one, you isolate the failure point. The AI doesn’t have to analyze the entire system at once — it can focus on one specific moment where something unexpected happens. This surgical approach is especially powerful for:
- Race conditions: Check state at each async boundary
- State management bugs: Verify state updates at each mutation point
- API integration issues: Inspect request/response at each network call
- Rendering problems: Check props and state at each render cycle
Real Example
Debugging Session
Breakpoint 1: User clicks submit
✅ formData is correctly populated
Breakpoint 2: Validation runs
✅ Validation passes, isValid = true
Breakpoint 3: API call preparation
❌ requestPayload should include userId, but it’s missing
AI Analysis: The userId is stored in context but not being extracted when building the payload. Fix: Add userId extraction before API call.
Tier 3: Documentation for Future LLMs
Some bugs are complex enough that solving them teaches you something important about your system. These bugs deserve documentation — not just for future humans, but for future LLMs that might encounter similar issues.
What to Document
Root Cause, Not Symptom
Don’t just say “the button was disabled.” Explain why: “The validation state wasn’t being propagated through the component tree because we were using local state instead of lifting it up.”
Sequence of Events
Document the exact sequence that led to the bug: “User fills form → validation runs → state updates → but component doesn’t re-render because...”
Why the Fix Works
Explain the solution and why it solves the problem: “We moved validation state to a shared context, which ensures all components receive updates synchronously.”
Patterns to Watch For
Identify similar patterns that might cause related bugs: “Watch for components that manage their own validation state when they should be using shared state.”
Test Cases
Include test cases that catch similar issues: “Test that validation state updates propagate to all dependent components.”
Storing Bug Reports
We keep bug reports in a searchable knowledge base — markdown files in a bugs/ or debugging/ folder. Each report includes:
- A descriptive title
- The root cause explanation
- The fix and why it works
- Code examples
- Related patterns to watch for
- Tags for searchability (e.g., “state-management”, “race-condition”)
When we encounter a similar bug, we can search the knowledge base and share the relevant bug report with the AI. This gives it context about similar issues we’ve solved before, dramatically improving its ability to diagnose and fix related problems.
The Complete Workflow in Practice
Here’s how a typical debugging session flows through all three tiers:
Tier 1: One-Shot Attempt
Take screenshot, describe suspicion, share code. AI analyzes and proposes fix. 95% success rate.
If Tier 1 Fails: Surgical Debugging
Break down execution chain. Set breakpoints. Check variables at each step. Move through stack systematically. AI helps identify where things diverge from expected behavior.
If Complex: Document for Future
Write bug report with root cause, sequence of events, fix explanation, and patterns to watch for. Store in searchable knowledge base for future LLMs and humans.
Throughout All Tiers:
Always have an AI assistant available. Use it to analyze, suggest, verify assumptions, and help think through each debugging decision.
Key Principles
Start Broad, Then Get Specific
Don’t immediately dive into the debugger. Give the AI maximum context first. Most bugs are obvious once you see them from the right angle.
Visual Context is Powerful
Screenshots, error messages, network requests — visual context helps the AI understand the problem faster than code alone.
Break Down Complex Problems
When the one-shot approach fails, break the problem into discrete steps. Check each step systematically. The AI excels at analyzing specific moments in execution.
Document for Future Reference
Complex bugs teach you something about your system. Document them so future LLMs (and humans) can learn from your debugging sessions.
The Assistant is Always There
Use the AI throughout the entire debugging process — not just for generating fixes, but for analyzing, suggesting, and helping you think through each decision.
Conclusion
Debugging with LLMs isn’t about replacing your debugging skills — it’s about amplifying them. The three-tier approach ensures you start with the most efficient method (the one-shot fix) and only dive deeper when necessary. By documenting complex bugs, you build institutional knowledge that makes future debugging sessions even faster.
The key is to always have an assistant at your side, ready to analyze, suggest, and help you think through each step. With this workflow, we solve 95% of bugs in the first attempt, and handle even the most complex issues systematically.
Try it on your next bug. Start with a screenshot and your suspicion. You might be surprised how often the AI finds the issue immediately.